425: Prospectuses and communications, business combinations
Published on November 3, 2021
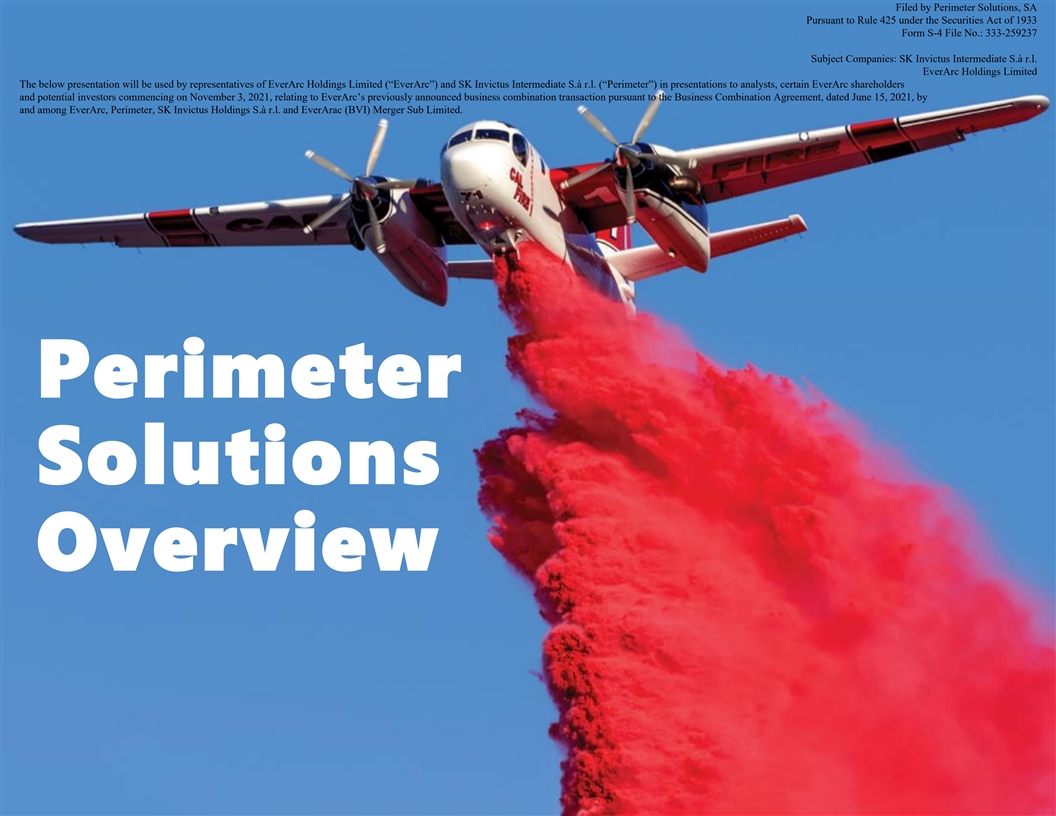
Filed by Perimeter Solutions, SA Pursuant to Rule 425 under the Securities Act of 1933 Form S-4 File No.: 333-259237 Subject Companies: SK Invictus Intermediate S.à r.l. EverArc Holdings Limited The below presentation will be used by representatives of EverArc Holdings Limited (“EverArc”) and SK Invictus Intermediate S.à r.l. (“Perimeter”) in presentations to analysts, certain EverArc shareholders and potential investors commencing on November 3, 2021, relating to EverArc’s previously announced business combination transaction pursuant to the Business Combination Agreement, dated June 15, 2021, by and among EverArc, Perimeter, SK Invictus Holdings S.à r.l. and EverArac (BVI) Merger Sub Limited. Perimeter Solutions Overview
Investor Presentation Disclaimer Use of Projections This presentation was prepared for informational purposes only by EverArc Holdings Ltd. ( EHL ) and SKI nvictus Holdings, S.à.r.l., (together with its affiliates and subsidiaries, SK ) and contains financial forecasts with respect to certain financial metrics of SK. Neither EHL's independent auditors, nor the independent registered public accounting firm of SK, audited, reviewed, compiled, or performeda ny procedures with respect to the projections for the purpose of their inclusion in this presentation, and accordingly, neither of them expressed an opinion or provided any other form of assurance with respect thereto for the purpose of this presentation. The financial forc easts and projections should not be relied upon as being necessarily indicative of future results. Neither EHL nor SK undertakes any commitment to update or revise the projections, whether as a result of new information, future events, or otherwise. The assumptions and estimates underlying the prospective financial information are inherently uncertain and are subject to a wide variety of significant business, economic, and competitive risks and uncertainties that could cause actual results to differ materially from those contained in the prospective financial information. Accordingly, there can be no assurance that the prospective forecasts areindicative of the future performance of EHL, SK or the combined company after completion of any proposed business combination or that actual results will not differ materially from those presented in the prospective financial information. Inclusion of the prospective finanical information in this presentation should not be regarded as a representation by any person that the results contained in the prospective financial information will be achieved. Forward-Looking Statements This presentation includes forward-looking statements. Forward-looking statements may be identified by the use of words such as forecast, intend, “strategy,” seek, target, anticipate, believe, expect, estimate, plan, outlook, “future,” “opportunity,” project, “may,” “should,” “will,” “would,” “will be,” “will continue,” “will likely result,” and other similar expressions that predic t or indicate future events or trends or that are not statements of historical matters. Forward-looking statements in this presentation may include, for example, statements about: (i) our expected compound annual growth rate, (ii) increases in fire severity and use of retardant, (iii) growth in fire safety tuck-ins, (iv) potential future acquisitions and (v) growth in fire safety volume, fire safety prices, oil additives, EBITDA margin and revenue. Such forward-looking statements with respect to revenues, earnings, performance, strategies, synergies, prospects, and other aspects of the businesses of EHL, SK, or the combined company after completion of any proposed business combination are based on current expectations that are subject to risks and uncertainties. A number of factors could cause actual results or outcomes to diffr e materially from those indicated by such forward-looking statements. These factors include, but are not limited to: (1) our substantial dependence on sales to the USDA Forest Service and the state of California and the risk of decreased sales to these customers; (2) changes in theregulation of the petrochemical industry, a downturn in the oil additives and/or fire-retardant end markets or our failure to accurately predict the frequency, duration, timing, and severity of changes in demand in such markets; (3) changes in customer relations or servicel evels; (4) changes in the availability of products from our suppliers on a long-term basis; (5) changes in the availability of third-party logistics suppliers for distribution, storage and transportation; (6) adverse effects on the demand for our products or services due to the seasonalo r cyclical nature of our business or severe weather events; and (7) current ongoing and future litigation, including multi-district litigation and other legal proceedings. Accordingly, forward-looking statements, including any projections or analysis, should not be viewed as factual and should not be relied upon as an accurate prediction of future results. There can be no assurance that historical trends will continue. The forward-looking statements contained in this presentation are based on our current expectations and beliefs concerning future developments and their poe tntial effects on EHL and SK. These forward-looking statements involve a number of risks, uncertainties (some of which are beyond our control), or other assumptions that may cause actual results or performance to be materially different from those expressed or implied by thesef orward-looking statements. These risks and uncertainties include, but are not limited to, those factors described in the risk factors to be provided to you. Should one or more of these risks or uncertainties materialize, or should any of our assumptions prove incorrect, actual resu lts may vary in material respects from those projected in these forward-looking statements. We undertake no obligation to update or revise any forward- looking statements, whether as a result of new information, future events or otherwise, except as may be required under applc iable securities laws. Accordingly, you should not put undue reliance on these statements. Neither EHL or SK, nor any of their respective affiliates, have any obligation to update this presentation. Although information and opinions expressed in this presentation were obtained from sources believed to be reliable and in good faith, no representation or warranty, express or implied, is made as to its accuracy or completeness. This presentation contains preliminary information only, is subject o t change at any time and is not, and should not be assumed to be, complete or to constitute all the information necessary to adequately make an informed decision regarding your engagement with EHL or SK. Use of Non-GAAP Financial Measures This presentation includes non-GAAP financial measures, including EBITDA. Management believes that these non-GAAP measures of financial results provide useful information to management and investors regarding certain financial and business trends relating to SK's financial condition and results of operations. EHL believes that the use of these non-GAAP financial measures provides an additional tool for investors to use in evaluating ongoing operating results and trends. Management does not consider these non-GAAP measures in isolation or as an alternative to financial measures determined in accordance with GAAP. The principal limitation of these non-GAAP financial measures is that they may exclude significant expenses and other items that are required by GAAP to be recorded in SK’s financial statements. In addition, they are subject to inherent limitations as they reflect the exercise of judgments by management about which expense and othe r items are excluded or included in determining these non-GAAP financial measures. Other companies may calculate non-GAAP measures differently, and therefore the non-GAAP measures of SK included in this presentation may not be directly comparable to similarly titled measures of other companies. Industry and Market Data; Trademarks and Trade Names In this presentation, EHL and SK rely on and refer to information and statistics regarding the sectors in which SK competes a nd other industry data. EHL and SK obtained this information and statistics from third-party sources, including reports by market research firms and government agencies. Neither EHL nor SK have independently verified the accuracy or completeness of the data contained in ths ee third-party sources and other publicly available information. Accordingly, none of EHL, SK nor their respective affiliates and advisors makes any representations as to the accuracy or completeness of these data. EHL and SK have supplemented this information where necessa ry with information from SK's own internal estimates, taking into account publicly available information about other industry participants and SK's management's best view as to information that is not publicly available. This data is subject to change. EHL and SK also own or have rights to various trademarks, service marks and trade names that they use in connection with the operation of their respective businesses. This presentation also contains trademarks, service marks and trade names of third parties, which are the property of their respective owners. The use or display of third parties' trademarks, service marks, trade names or productsi n this presentation is not intended to, and does not imply, a relationship with EHL or SK, or an endorsement or sponsorship by or of EHL or SK. All rights to the trademarks, copyrights, logos and other intellectual property listed herein belong to their respective owners and EHL orS K use thereof does not imply an affiliation with, or endorsement by the owners of such trademarks, copyrights, logos and other intellectual property. Solely for convenience, the trademarks, service marks and trade names referred to in this presentation may appear without the®, TM or SM symbols, but such references are not intended to indicate, in any way, that EHL or SK will not assert, to the fullest extent under applicable law, their rights or the right of the applicable licensor to these trademarks, service marks and trade names. No Offer or Solicitation This presentation and any oral statements made in connection with this presentation are for informational purposes only and a re neither an offer to purchase, nor a solicitation of an offer to sell, subscribe for or buy any securities or the solicitation of any vote in any jurisdiction pursuant to the proposed transactions or otherwise, nor shall there be any sale, issuance or transfer of securities in any ju risdiction in contravention of applicable law. Important Information about the Merger and Wear to Find It In connection with the proposed business combination, Perimeter Solutions, SA (“Holdco”), a subsidiary of EverArc Holdings Limited (“EverArc”), will become the holding company of EverArc and SK Invictus Intermediate S.àr.l. (“Perimeter”) as of the closing of the proposed business combination. Holdco has filed a registration statement on Form S-4 (the “Form S-4”) with the U.S. Securities and Exchange Commission (the “SEC”) in connection with the proposed business combination. Holdco, EverArc and Perimeter urge investors, stockholders and other interested persons to read, when available, the Form S-4, as well as other documents filed with the SEC in connection with the proposed transaction, as these materials will contain important information about Holdco, EverArc and Perimeter and the proposed business combination. Investors can obtain a copy of the Form S-4 and other documents filed with the SEC without charge at the SEC's webs ite (www.sec.gov). 2

Presenters Nick Howley Co-Chairman Eddie Goldberg CEO Haitham Khouri Director 3
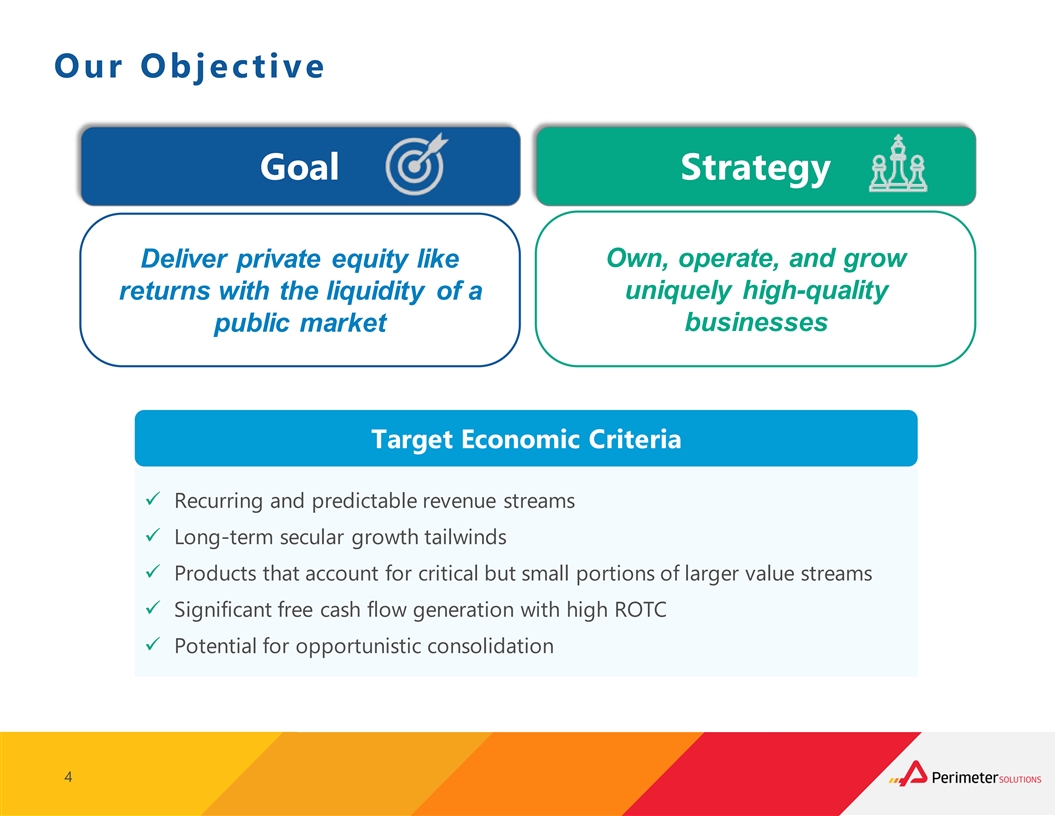
Our Objective Goal Strategy Own, operate, and grow Deliver private equity like uniquely high-quality returns with the liquidity of a businesses public market Target Economic Criteria ü Recurring and predictable revenue streams ü Long-term secular growth tailwinds ü Products that account for critical but small portions of larger value streams ü Significant free cash flow generation with high ROTC ü Potential for opportunistic consolidation 4
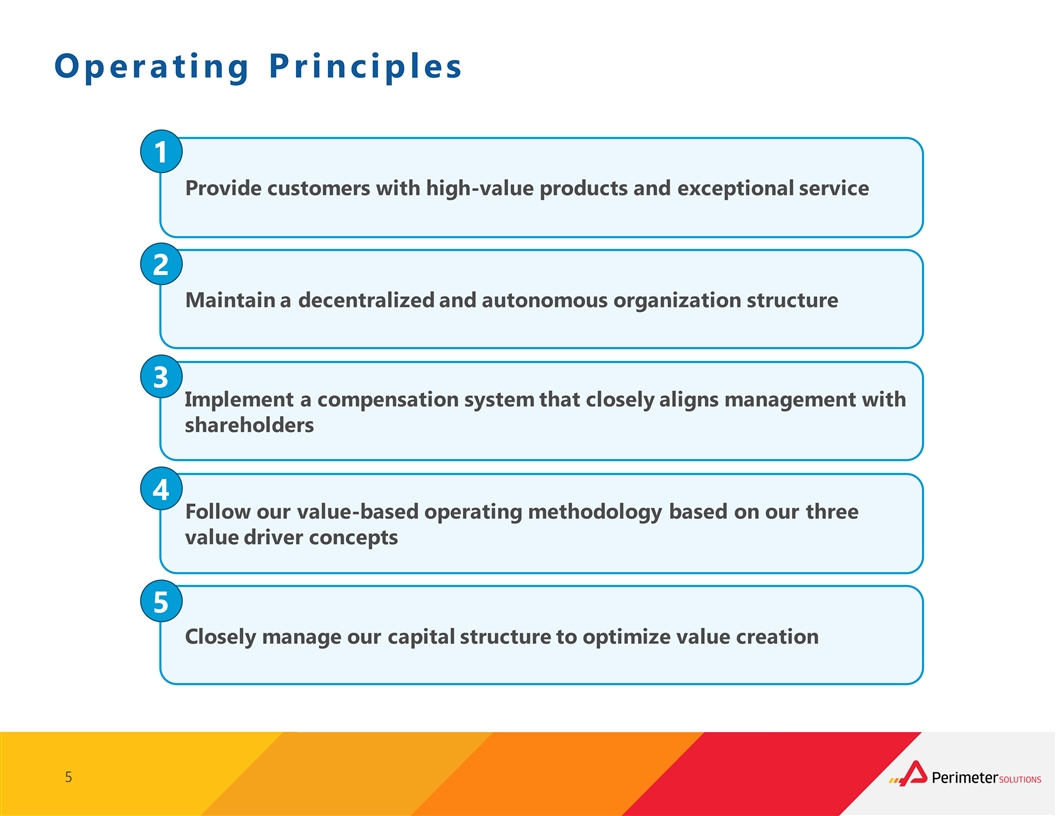
Operating Principles 1 Provide customers with high-value products and exceptional service 2 Maintain a decentralized and autonomous organization structure 3 Implement a compensation system that closely aligns management with shareholders 4 Follow our value-based operating methodology based on our three value driver concepts 5 Closely manage our capital structure to optimize value creation 5
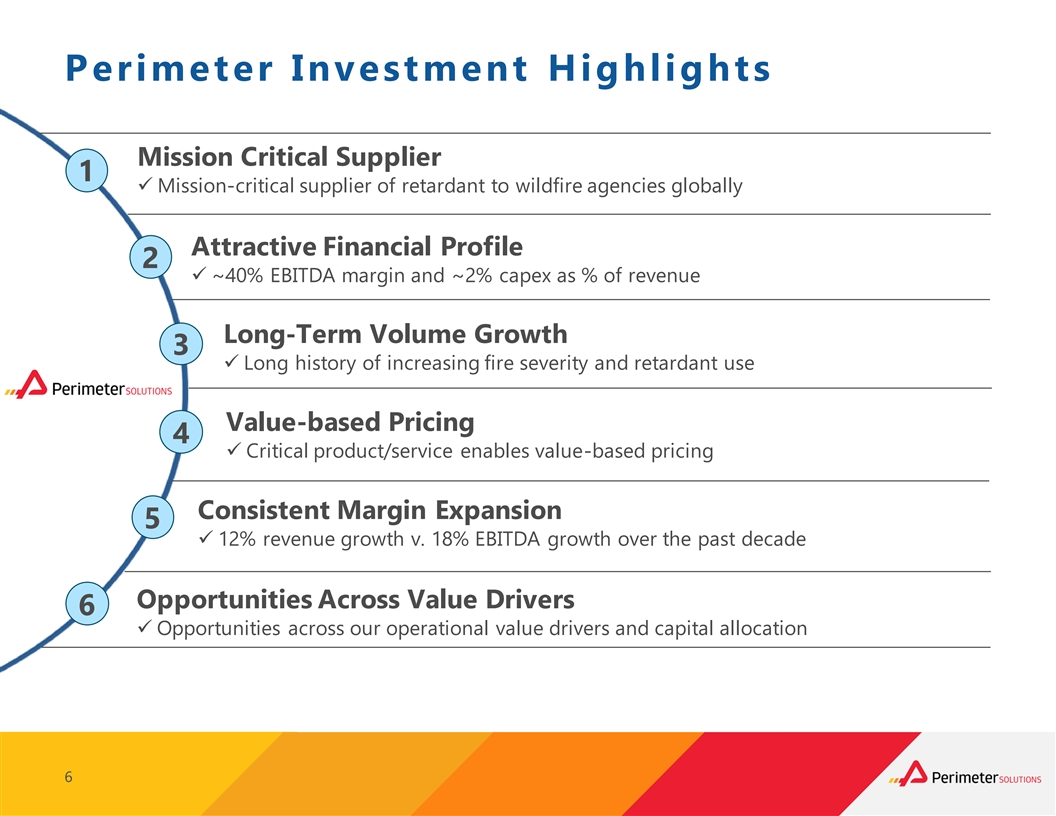
Perimeter Investment Highlights Mission Critical Supplier 1 ü Mission-critical supplier of retardant to wildfire agencies globally Attractive Financial Profile 2 ü ~40% EBITDA margin and ~2% capex as % of revenue Long-Term Volume Growth 3 ü Long history of increasing fire severity and retardant use Value-based Pricing 4 ü Critical product/service enables value-based pricing Consistent Margin Expansion 5 ü 12% revenue growth v. 18% EBITDA growth over the past decade Opportunities Across Value Drivers 6 ü Opportunities across our operational value drivers and capital allocation 6 6
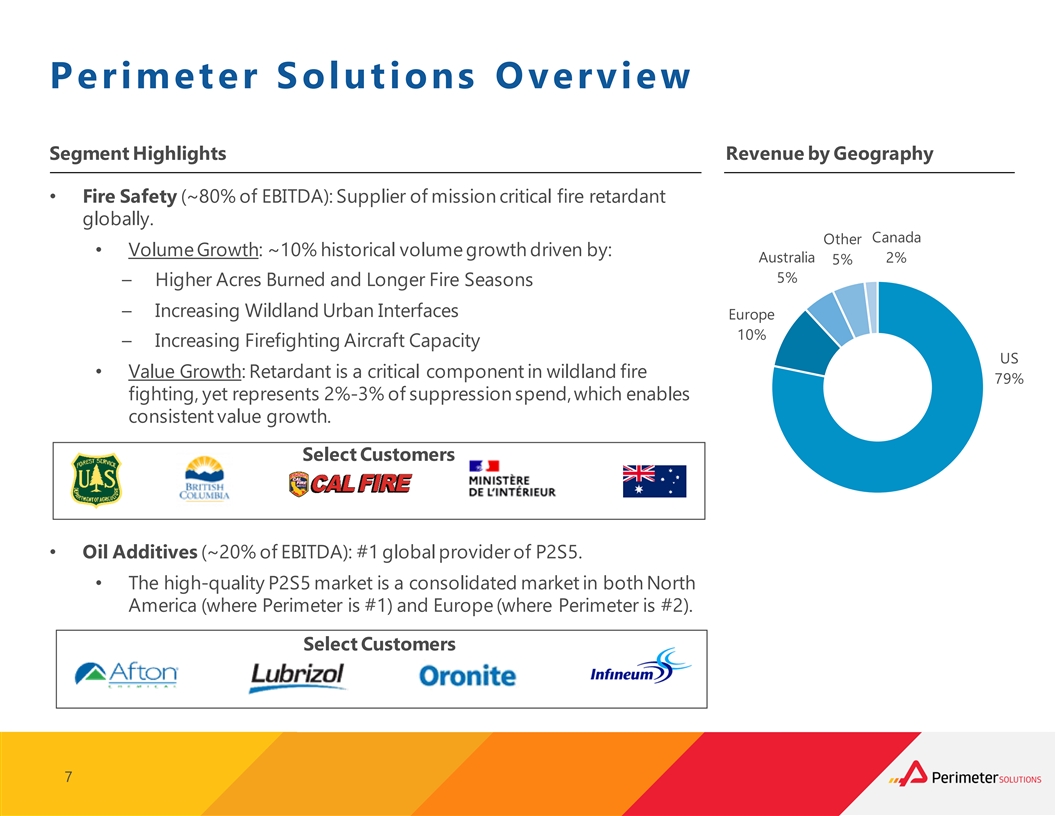
Perimeter Solutions Overview Segment Highlights Revenue by Geography • Fire Safety (~80% of EBITDA): Supplier of mission critical fire retardant globally. Canada Other • Volume Growth: ~10% historical volume growth driven by: Australia 2% 5% 5% – Higher Acres Burned and Longer Fire Seasons – Increasing Wildland Urban Interfaces Europe 10% – Increasing Firefighting Aircraft Capacity US • Value Growth: Retardant is a critical component in wildland fire 79% fighting, yet represents 2%-3% of suppression spend, which enables consistent value growth. Select Customers • Oil Additives (~20% of EBITDA): #1 global provider of P2S5. • The high-quality P2S5 market is a consolidated market in both North America (where Perimeter is #1) and Europe (where Perimeter is #2). Select Customers 7 7
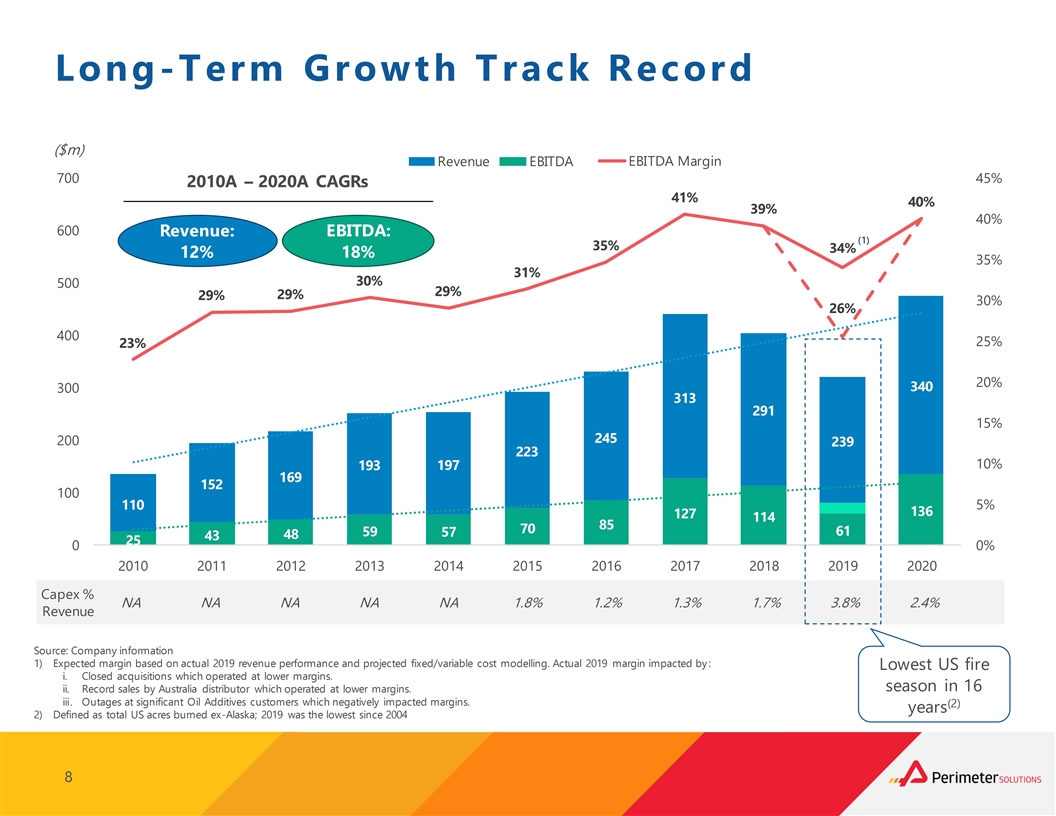
Long-Term Growth Track Record ($m) R EB eIvT eD nA ue R EB eIv Te D nA ue EBITDA Margin 700 45% 2010A – 2020A CAGRs 41% 40% 39% 40% 600 Revenue: EBITDA: (1) 35% 34% 12% 18% 35% 31% 30% 500 29% 29% 29% 30% 26% 400 25% 23% 20% 340 300 313 291 15% 245 200 239 223 10% 193 197 169 152 100 110 5% 136 127 114 85 70 59 61 57 48 43 25 0 0% 2010 2011 2012 2013 2014 2015 2016 2017 2018 2019 2020 Capex % NA NA NA NA NA 1.8% 1.2% 1.3% 1.7% 3.8% 2.4% Revenue Source: Company information 1) Expected margin based on actual 2019 revenue performance and projected fixed/variable cost modelling. Actual 2019 margin impacted by : Lowest US fire i. Closed acquisitions which operated at lower margins. season in 16 ii. Record sales by Australia distributor which operated at lower margins. iii. Outages at significant Oil Additives customers which negatively impacted margins. (2) years 2) Defined as total US acres burned ex-Alaska; 2019 was the lowest since 2004 8
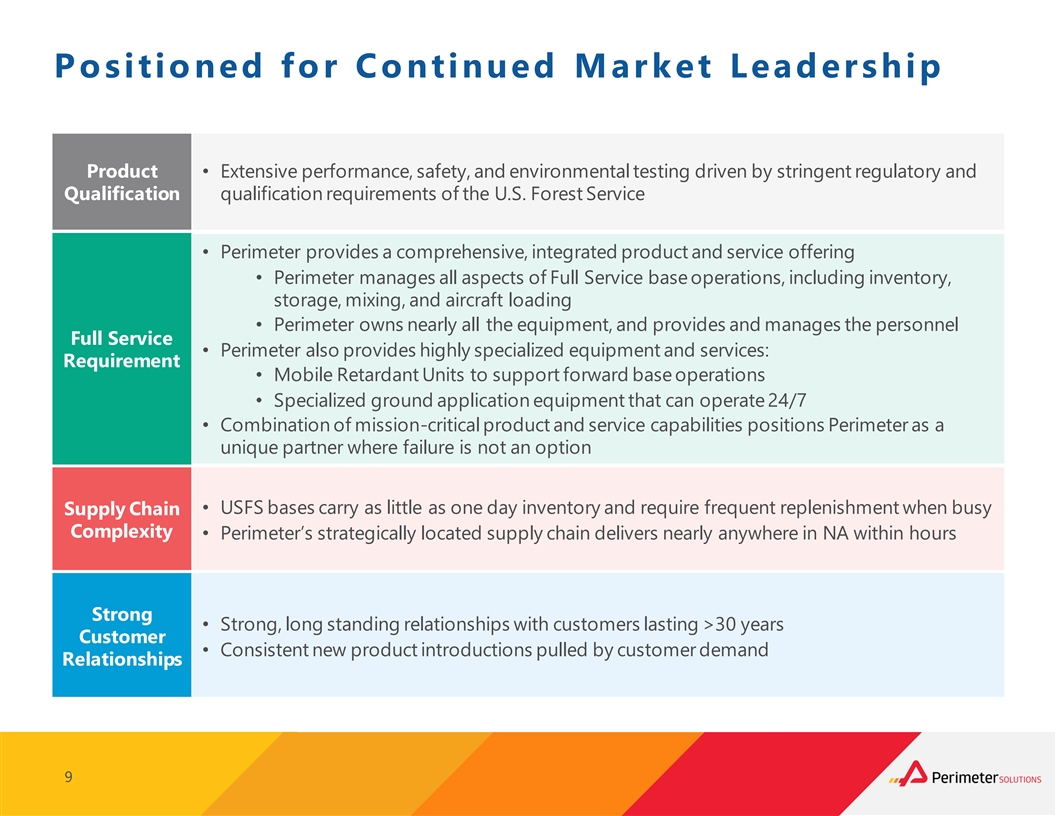
Po sitioned for Continued Market Leadership Product • Extensive performance, safety, and environmental testing driven by stringent regulatory and Qualification qualification requirements of the U.S. Forest Service • Perimeter provides a comprehensive, integrated product and service offering • Perimeter manages all aspects of Full Service base operations, including inventory, storage, mixing, and aircraft loading • Perimeter owns nearly all the equipment, and provides and manages the personnel Full Service • Perimeter also provides highly specialized equipment and services: Requirement • Mobile Retardant Units to support forward base operations • Specialized ground application equipment that can operate 24/7 • Combination of mission-critical product and service capabilities positions Perimeter as a unique partner where failure is not an option • USFS bases carry as little as one day inventory and require frequent replenishment when busy Supply Chain Complexity • Perimeter’s strategically located supply chain delivers nearly anywhere in NA within hours Strong • Strong, long standing relationships with customers lasting >30 years Customer • Consistent new product introductions pulled by customer demand Relationships 9
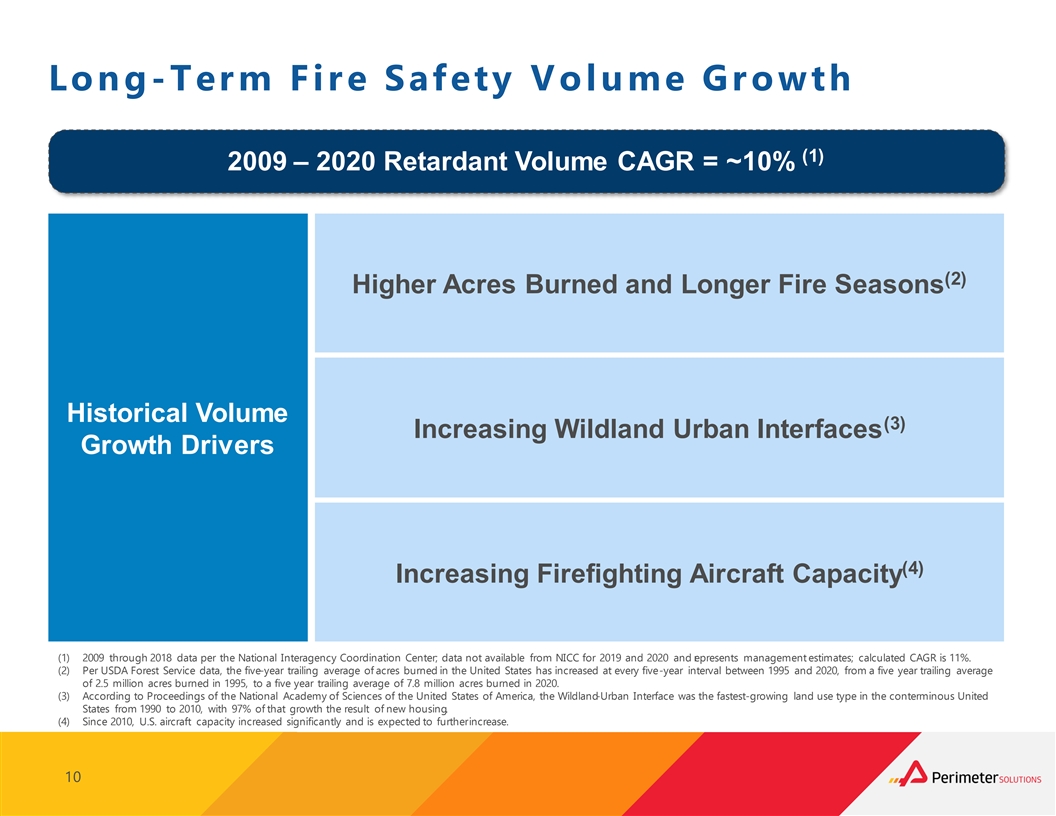
Long-Term Fire Safety Volume Growth (1) 2009 – 2020 Retardant Volume CAGR = ~10% (2) Higher Acres Burned and Longer Fire Seasons Historical Volume (3) Increasing Wildland Urban Interfaces Growth Drivers (4) Increasing Firefighting Aircraft Capacity (1) 2009 through 2018 data per the National Interagency Coordination Center; data not available from NICC for 2019 and 2020 and r epresents management estimates; calculated CAGR is 11%. (2) Per USDA Forest Service data, the five-year trailing average of acres burned in the United States has increased at every five-year interval between 1995 and 2020, from a five year trailing average of 2.5 million acres burned in 1995, to a five year trailing average of 7.8 million acres burned in 2020. (3) According to Proceedings of the National Academy of Sciences of the United States of America, the Wildland-Urban Interface was the fastest-growing land use type in the conterminous United States from 1990 to 2010, with 97% of that growth the result of new housing. (4) Since 2010, U.S. aircraft capacity increased significantly and is expected to further increase. 10
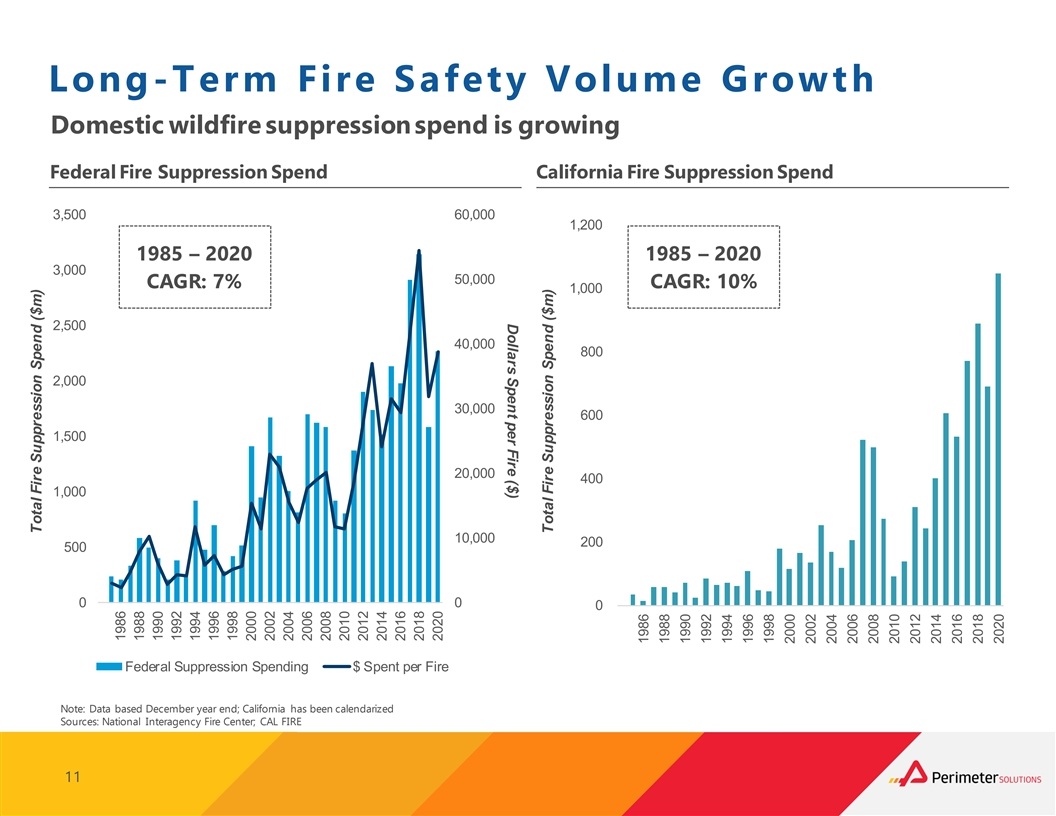
Dollars Spent per Fire ($) Long-Term Fire Safety Volume Growth Domestic wildfire suppression spend is growing Federal Fire Suppression Spend California Fire Suppression Spend 3,500 60,000 1,200 1985 – 2020 1985 – 2020 3,000 50,000 CAGR: 7% CAGR: 10% 1,000 2,500 40,000 800 2,000 30,000 600 1,500 20,000 400 1,000 10,000 200 500 0 0 0 Federal Suppression Spending $ Spent per Fire Note: Data based December year end; California has been calendarized Sources: National Interagency Fire Center; CAL FIRE 11 Total Fire Suppression Spend ($m) 1984 1986 1988 1990 1992 1994 1996 1998 2000 2002 2004 2006 2008 2010 2012 2014 2016 2018 2020 Total Fire Suppression Spend ($m) 1984 1986 1988 1990 1992 1994 1996 1998 2000 2002 2004 2006 2008 2010 2012 2014 2016 2018 2020
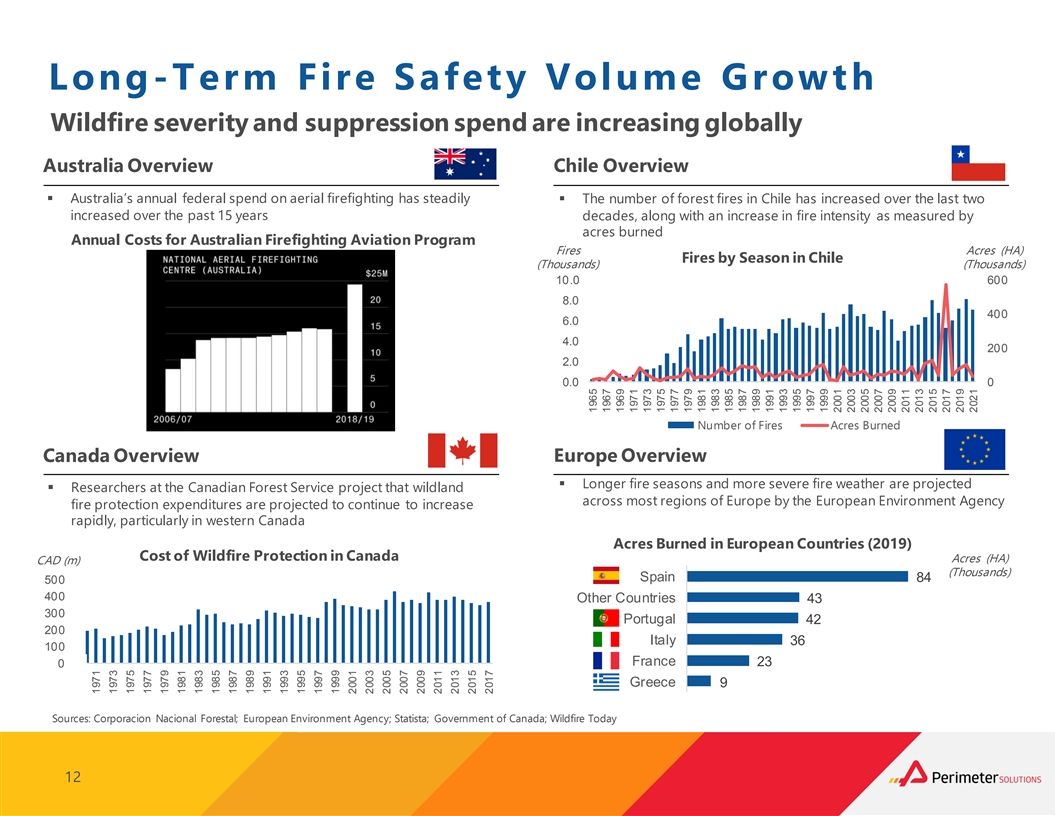
Long-Term Fire Safety Volume Growth Wildfire severity and suppression spend are increasing globally Australia Overview Chile Overview § Australia’s annual federal spend on aerial firefighting has steadily § The number of forest fires in Chile has increased over the last two increased over the past 15 years decades, along with an increase in fire intensity as measured by acres burned Annual Costs for Australian Firefighting Aviation Program Fires Acres (HA) Fires by Season in Chile (Thousands) (Thousands) 10.0 600 8.0 400 6.0 4.0 200 2.0 0.0 0 Number of Fires Acres Burned Canada Overview Europe Overview § Longer fire seasons and more severe fire weather are projected § Researchers at the Canadian Forest Service project that wildland across most regions of Europe by the European Environment Agency fire protection expenditures are projected to continue to increase rapidly, particularly in western Canada Acres Burned in European Countries (2019) Cost of Wildfire Protection in Canada Acres (HA) CAD (m) (Thousands) Spain 84 500 400 Other Countries 43 300 Portugal 42 200 Italy 36 100 France 23 0 Greece 9 Sources: Corporacion Nacional Forestal; European Environment Agency; Statista; Government of Canada; Wildfire Today 12 1969 1971 1973 1975 1977 1979 1981 1983 1985 1987 1989 1991 1993 1995 1997 1999 2001 2003 2005 2007 2009 2011 2013 2015 2017 1965 1967 1969 1971 1973 1975 1977 1979 1981 1983 1985 1987 1989 1991 1993 1995 1997 1999 2001 2003 2005 2007 2009 2011 2013 2015 2017 2019 2021
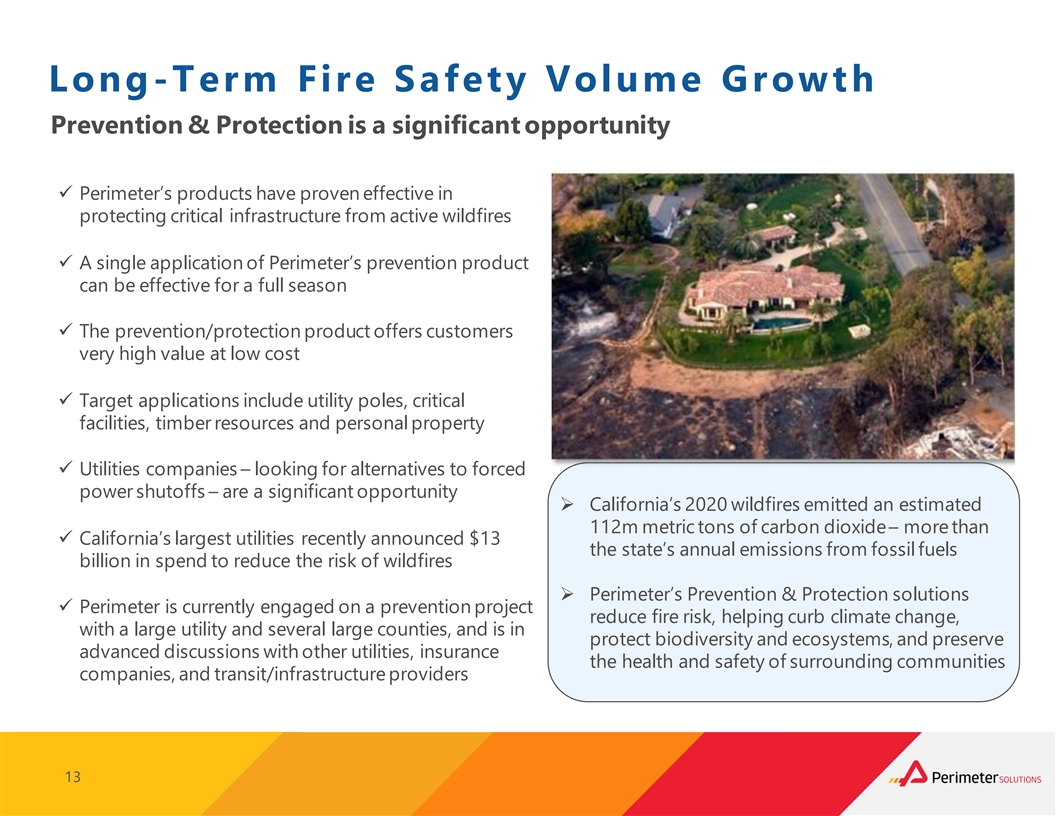
Long-Term Fire Safety Volume Growth Prevention & Protection is a significant opportunity ü Perimeter’s products have proven effective in protecting critical infrastructure from active wildfires ü A single application of Perimeter’s prevention product can be effective for a full season ü The prevention/protection product offers customers very high value at low cost ü Target applications include utility poles, critical facilities, timber resources and personal property ü Utilities companies – looking for alternatives to forced power shutoffs – are a significant opportunity Ø California’s 2020 wildfires emitted an estimated 112m metric tons of carbon dioxide – more than ü California’s largest utilities recently announced $13 the state’s annual emissions from fossil fuels billion in spend to reduce the risk of wildfires Ø Perimeter’s Prevention & Protection solutions ü Perimeter is currently engaged on a prevention project reduce fire risk, helping curb climate change, with a large utility and several large counties, and is in protect biodiversity and ecosystems, and preserve advanced discussions with other utilities, insurance the health and safety of surrounding communities companies, and transit/infrastructure providers 13
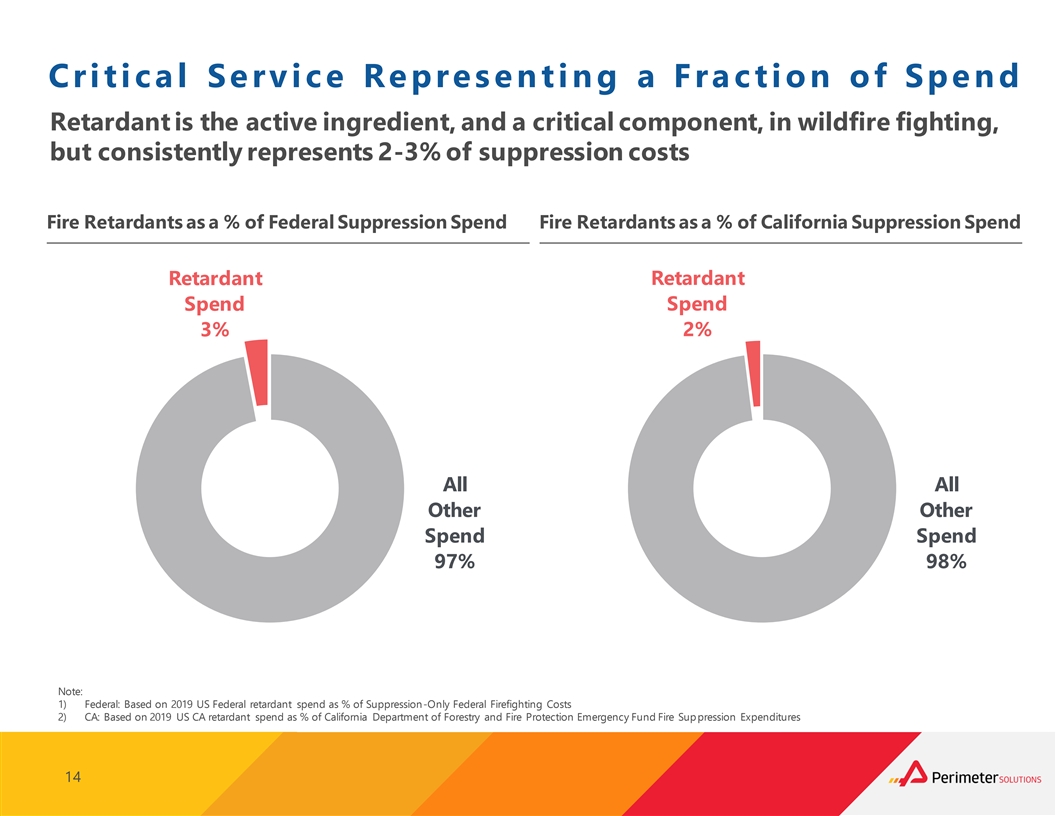
Critica l Service Repres enting a Fra ction of Spend Retardant is the active ingredient, and a critical component, in wildfire fighting, but consistently represents 2-3% of suppression costs Fire Retardants as a % of Federal Suppression Spend Fire Retardants as a % of California Suppression Spend Retardant Retardant Spend Spend 3% 2% All All Other Other Spend Spend 97% 98% Note: 1) Federal: Based on 2019 US Federal retardant spend as % of Suppression-Only Federal Firefighting Costs 2) CA: Based on 2019 US CA retardant spend as % of California Department of Forestry and Fire Protection Emergency Fund Fire Suppression Expenditures 14
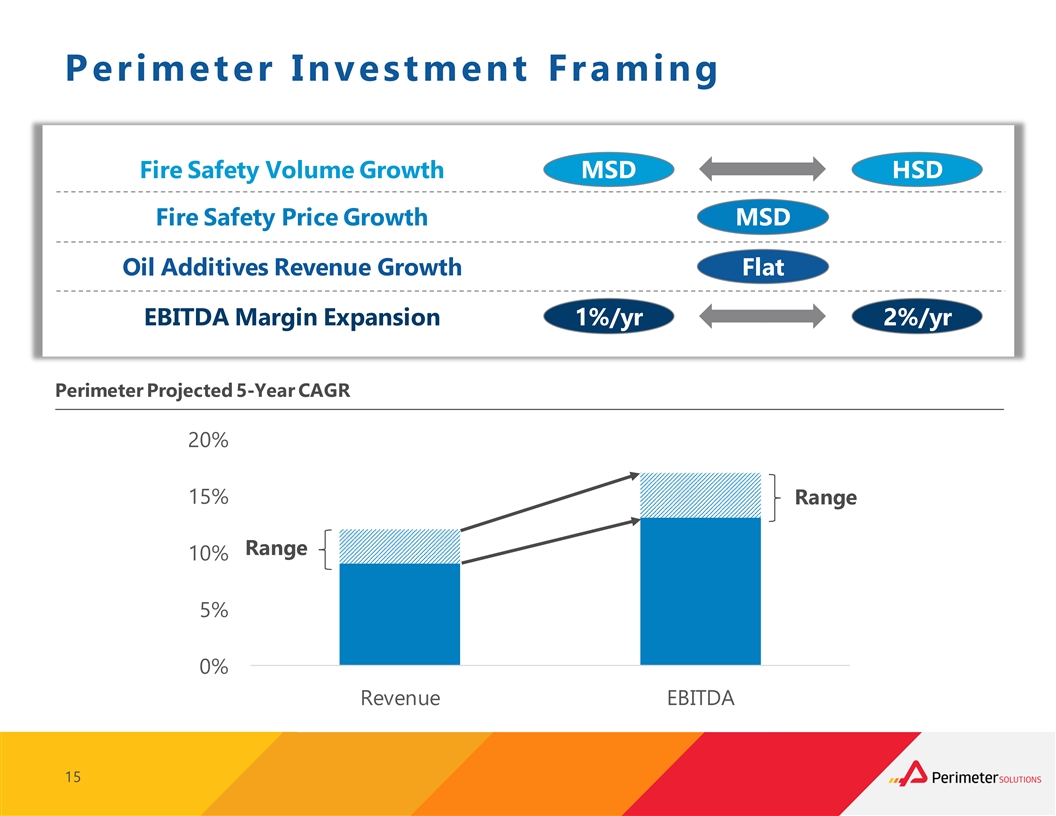
Perimeter Investment Framing Fire Safety Volume Growth MSD HSD Fire Safety Price Growth MSD Oil Additives Revenue Growth Flat EBITDA Margin Expansion 1%/yr 2%/yr Perimeter Projected 5-Year CAGR 20% 15% Range Range 10% 5% 0% Revenue EBITDA 15
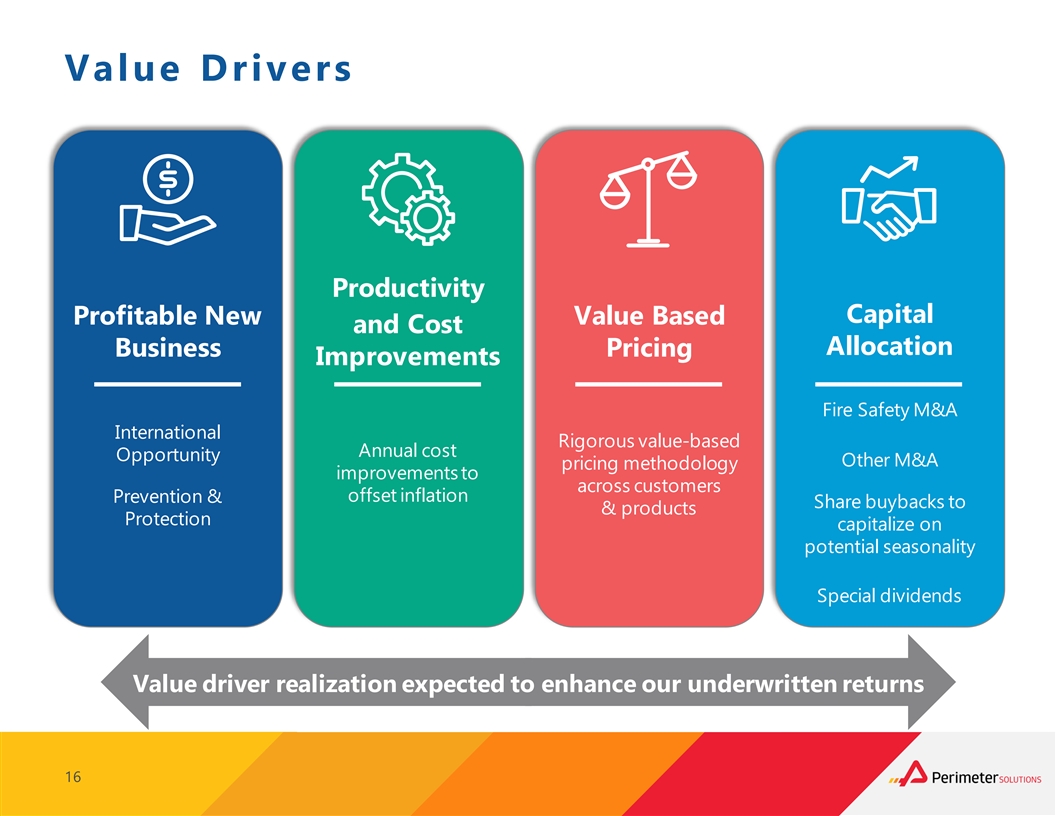
Value Drivers Productivity Capital Profitable New Value Based and Cost Allocation Business Pricing Improvements Fire Safety M&A International Rigorous value-based Annual cost Opportunity Other M&A pricing methodology improvements to across customers offset inflation Prevention & Share buybacks to & products Protection capitalize on potential seasonality Special dividends Value driver realization expected to enhance our underwritten returns 16
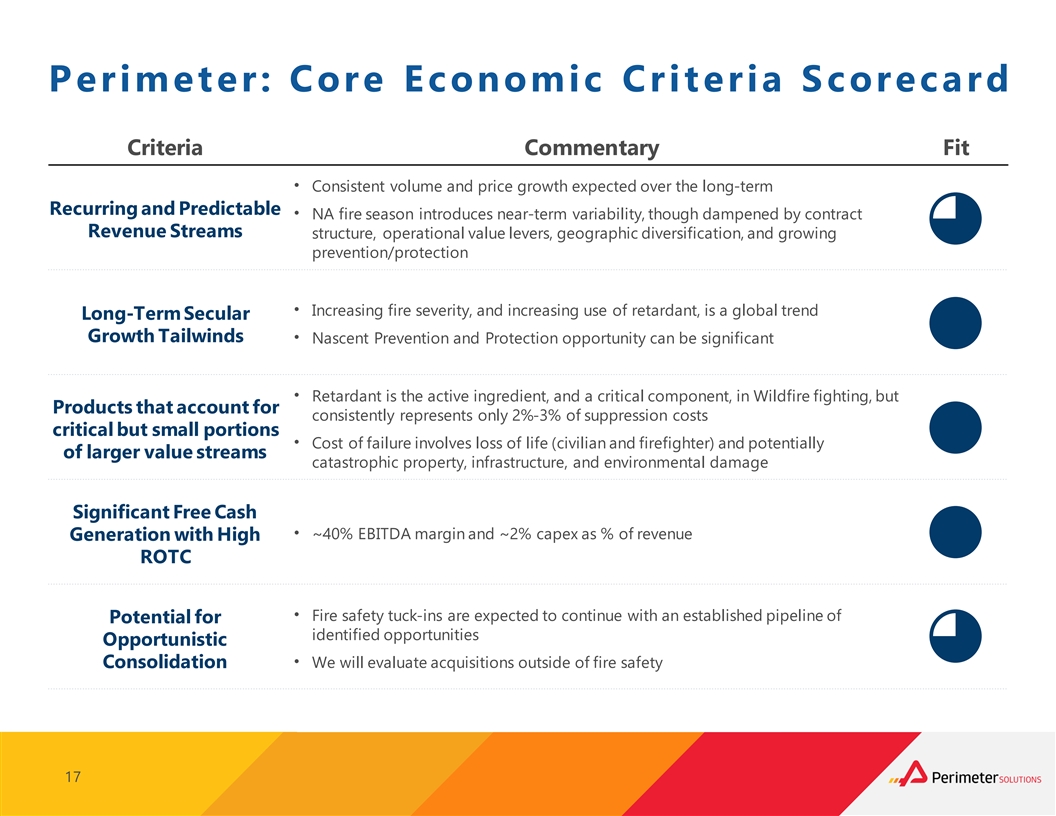
Perimeter: Core Economic Criteria Scorecard Criteria Commentary Fit • Consistent volume and price growth expected over the long-term Recurring and Predictable • NA fire season introduces near-term variability, though dampened by contract Revenue Streams structure, operational value levers, geographic diversification, and growing prevention/protection • Increasing fire severity, and increasing use of retardant, is a global trend Long-Term Secular Growth Tailwinds• Nascent Prevention and Protection opportunity can be significant • Retardant is the active ingredient, and a critical component, in Wildfire fighting, but Products that account for consistently represents only 2%-3% of suppression costs critical but small portions • Cost of failure involves loss of life (civilian and firefighter) and potentially of larger value streams catastrophic property, infrastructure, and environmental damage Significant Free Cash • ~40% EBITDA margin and ~2% capex as % of revenue Generation with High ROTC • Fire safety tuck-ins are expected to continue with an established pipeline of Potential for identified opportunities Opportunistic • Consolidation We will evaluate acquisitions outside of fire safety 17
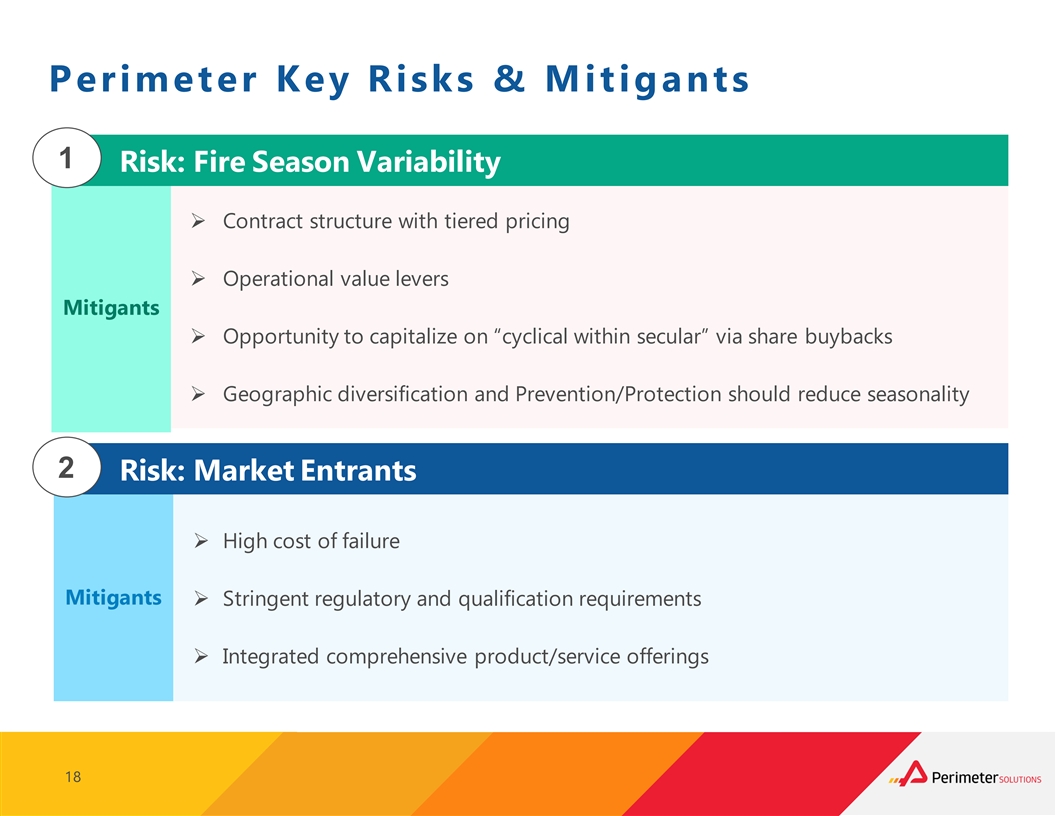
Perimeter Key Risks & Mitigants 1 Risk: Fire Season Variability Ø Contract structure with tiered pricing Ø Operational value levers Mitigants Ø Opportunity to capitalize on “cyclical within secular” via share buybacks Ø Geographic diversification and Prevention/Protection should reduce seasonality 2 Risk: Market Entrants Ø High cost of failure Mitigants Ø Stringent regulatory and qualification requirements Ø Integrated comprehensive product/service offerings 18 18
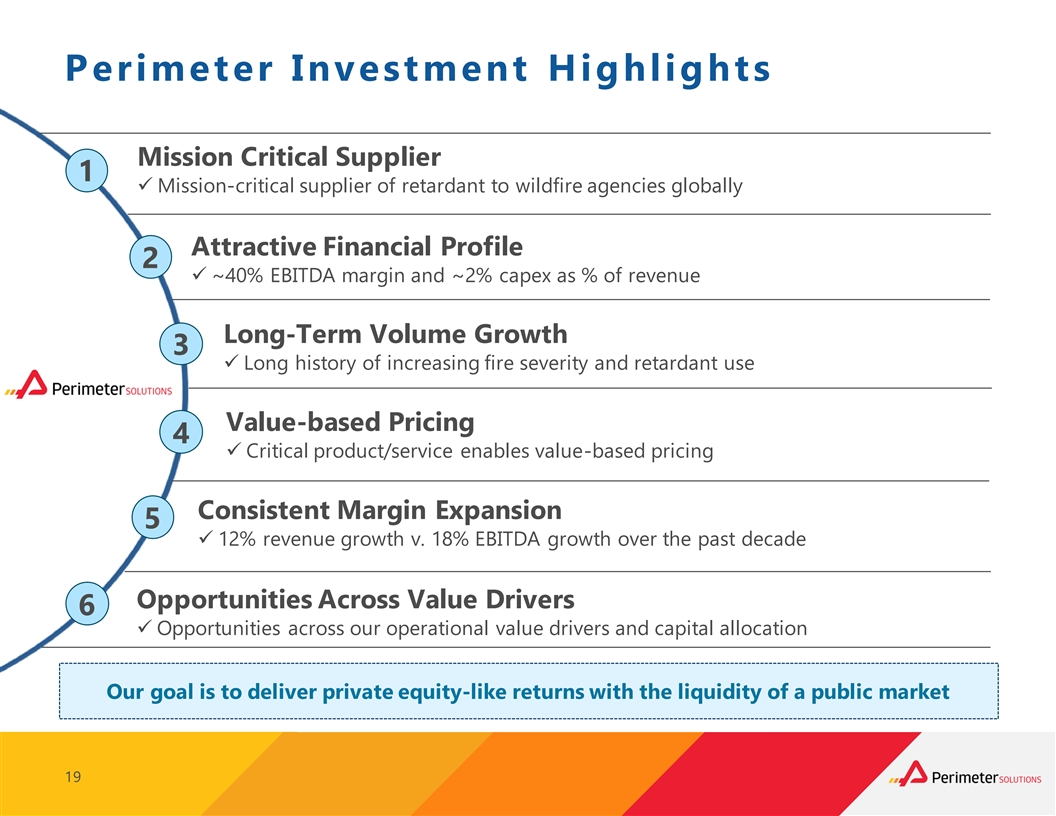
Perimeter Investment Highlights Mission Critical Supplier 1 ü Mission-critical supplier of retardant to wildfire agencies globally Attractive Financial Profile 2 ü ~40% EBITDA margin and ~2% capex as % of revenue Long-Term Volume Growth 3 ü Long history of increasing fire severity and retardant use Value-based Pricing 4 ü Critical product/service enables value-based pricing Consistent Margin Expansion 5 ü 12% revenue growth v. 18% EBITDA growth over the past decade Opportunities Across Value Drivers 6 ü Opportunities across our operational value drivers and capital allocation Our goal is to deliver private equity-like returns with the liquidity of a public market 19 19